- Events
-
Partners
- Government
- Customer Portal
- Contact Us
- Contact Sales
-
English
Why the SolarWinds Orion Platform?
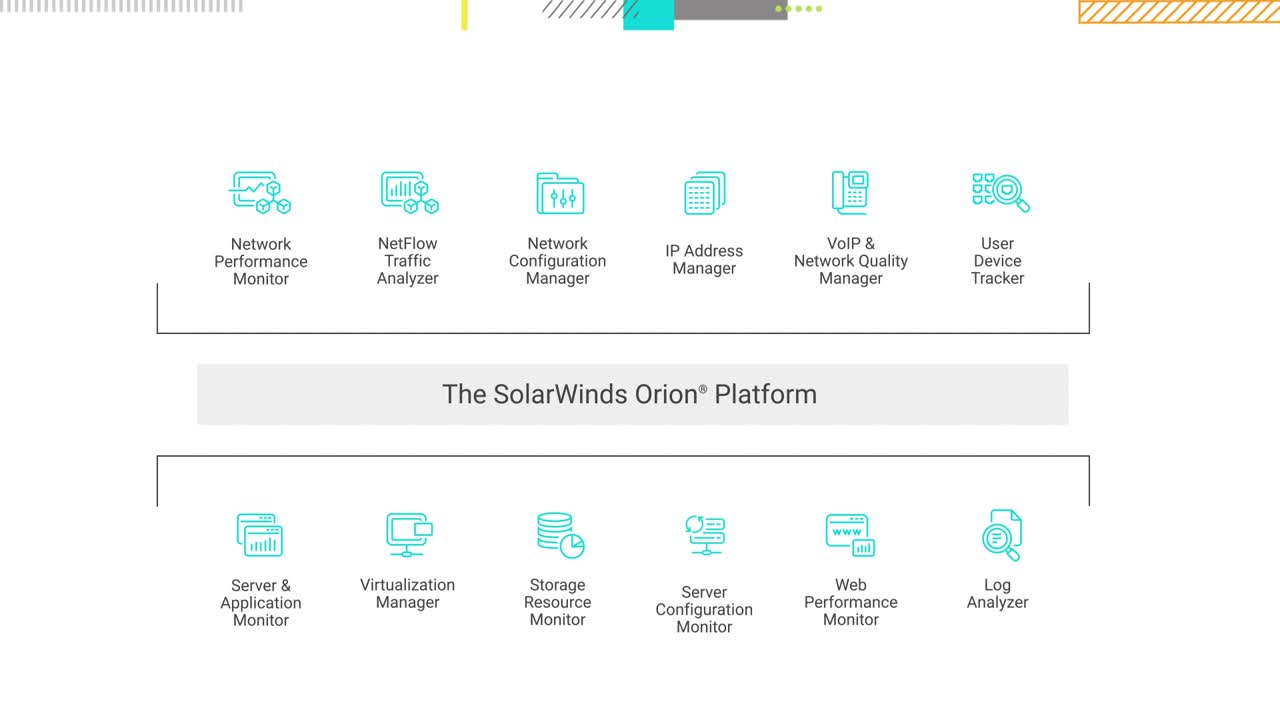
The SolarWinds® Orion® Platform is a powerful, scalable infrastructure monitoring and management platform designed to simplify IT administration for on-premises, hybrid, and software as a service (SaaS) environments in a single pane of glass.
There’s no need to struggle with multiple incompatible point monitoring products, as the Orion Platform consolidates the full suite of monitoring capabilities into one platform with cross-stack integrated functionality.
Customers today shouldn’t have to deal with a collection of spreadsheets, incompatible tools, swivel-chair management, and overpriced products and deployment services. The SolarWinds Orion Platform can help conquer your infrastructure monitoring and management by offering superior tool consolidation for your environment while providing unique integrated functionalities, allowing customers to join the dots and solve problems with accuracy and speed at an affordable price.
The IT landscape is evolving rapidly with applications, services, and infrastructure both on-premises and in the cloud. Applications, which run on-premises today, may move to the cloud in the near future. How can you keep up with all this change? The Orion Platform and many of its modules can monitor entities on-premises and in the cloud. It can also be deployed on-premises, in the cloud, or a mix. The Orion Platform evolves with the latest IT trends.
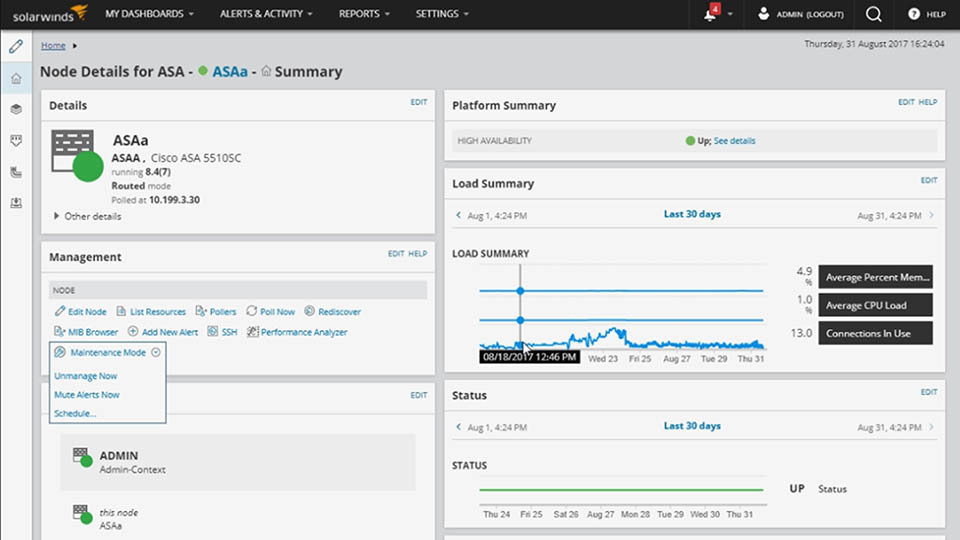
Networks today often contain complex hardware not well covered by standard monitoring tools. The SolarWinds Network Insight™ feature in the Orion Platform simplifies the management of complex network devices such as Cisco ASA firewalls, Cisco Nexus gear, Palo Alto Networks firewalls, and F5 BIG-IP by providing the right information for each device’s unique role in the network.
A key benefit for all the modules installed on the SolarWinds Orion Platform is being able to benefit from a common set of shared services offered by the platform. This allows better availability, insight, and faster problem resolution with common services such as high availability, consolidated alerts, and a consolidated message center. The platform can also be scaled out to meet business growth demands.
One of the goals of the SolarWinds Orion Platform is to allow customers to see the big picture across the complete IT stack. A key part of this is providing smart integrations between several of the modules on the platform and approaching issues from different angles. This facilitates connected use cases for connected problems. Additionally, integrations to native SolarWinds Orion Platform products such as in the database layer broadens the field of view.
Customers today shouldn’t have to deal with a collection of spreadsheets, incompatible tools, swivel-chair management, and overpriced products and deployment services. The SolarWinds Orion Platform can help conquer your infrastructure monitoring and management by offering superior tool consolidation for your environment while providing unique integrated functionalities, allowing customers to join the dots and solve problems with accuracy and speed at an affordable price.
The IT landscape is evolving rapidly with applications, services, and infrastructure both on-premises and in the cloud. Applications, which run on-premises today, may move to the cloud in the near future. How can you keep up with all this change? The Orion Platform and many of its modules can monitor entities on-premises and in the cloud. It can also be deployed on-premises, in the cloud, or a mix. The Orion Platform evolves with the latest IT trends.
Networks today often contain complex hardware not well covered by standard monitoring tools. The SolarWinds Network Insight™ feature in the Orion Platform simplifies the management of complex network devices such as Cisco ASA firewalls, Cisco Nexus gear, Palo Alto Networks firewalls, and F5 BIG-IP by providing the right information for each device’s unique role in the network.
A key benefit for all the modules installed on the SolarWinds Orion Platform is being able to benefit from a common set of shared services offered by the platform. This allows better availability, insight, and faster problem resolution with common services such as high availability, consolidated alerts, and a consolidated message center. The platform can also be scaled out to meet business growth demands.
One of the goals of the SolarWinds Orion Platform is to allow customers to see the big picture across the complete IT stack. A key part of this is providing smart integrations between several of the modules on the platform and approaching issues from different angles. This facilitates connected use cases for connected problems. Additionally, integrations to native SolarWinds Orion Platform products such as in the database layer broadens the field of view.
Explore Our Orion Platform Products
Orion Platform Products
Network Performance Monitor
SolarWinds Network Performance Monitor (NPM) is a powerful and affordable network monitoring software enabling you to quickly detect, diagnose, and resolve network performance problems and outages.
NetFlow Traffic Analyzer
An add-on to Network Performance Monitor, SolarWinds NetFlow Traffic Analyzer (NTA) is a multi-vendor flow analysis tool designed to proactively reduce network downtime. NTA delivers actionable insights to help IT pros troubleshoot and optimize spend on bandwidth by better understanding the who, what, and where of traffic consumption.
Network Configuration Manager
SolarWinds Network Configuration Manager (NCM) can help save time and improve network reliability and security by managing configurations, changes, and compliance for routers, switches, and other network devices.
Accelerate troubleshooting of performance issues following configuration changes through integration with the Orion Platform’s PerfStack feature.
IP Address Manager
A big part of dealing with today’s complex networks and the challenges they present begins with managing your inventory of IP addresses and vital DHCP and DNS resources. SolarWinds IP Address Manager (IPAM) can provide you with centralized IP address management working hand-in-hand with unified DHCP and DNS administration and helping teams find and configure available addresses on DHCP and DNS systems.
VoIP & Network Quality Manager
SolarWinds VoIP & Network Quality Manager (VNQM) is designed to monitor VoIP performance by analyzing call detail records generated by Cisco Unified Communications Manager and Avaya Aura Communication Manager, and can help you proactively identify and eliminate distortion, latency, and noise. It can also generate synthetic VoIP traffic using Cisco IP SLA technology and facilitate capacity planning and measurement of voice quality in advance of new VoIP deployments. VNQM is also built to track key edge router and switch statistics and can help you keep a close eye on site-to-site WAN performance.
User Device Tracker
SolarWinds User Device Tracker (UDT) delivers automated user and device tracking along with powerful switch port management capabilities, so you can stay in control of who and what connects to your network. Quickly find a computer or user and track down lost or rogue devices with a simple search on a username, IP address, hostname, or MAC address.
Server & Application Monitor
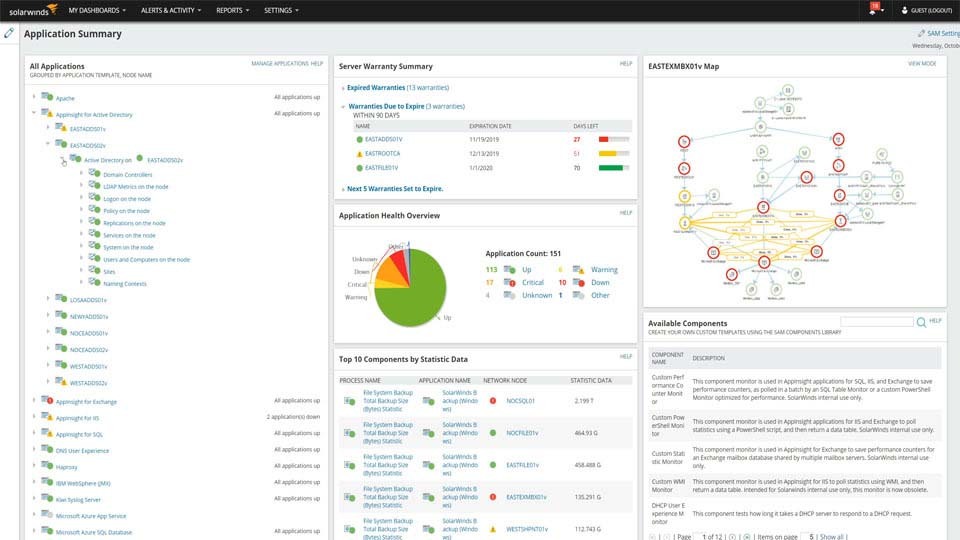
SolarWinds Server & Application Monitor (SAM) is designed to monitor your applications and their supporting infrastructure, whether running on-premises, in the cloud, or in a hybrid environment. Don’t let slow applications and downtime impact your end users and business services. Pinpoint the root cause of application issues across various layers of the IT stack. Automatically discover your application’s environment and start monitoring typically in about an hour. No professional services or consultation needed.
Server Configuration Monitor
When configurations start to drift, the impact can be very serious: Outages, slowdowns, security breaches, and compliance violations. SolarWinds Server Configuration Monitor (SCM) is designed to quickly reveal when server, application, or database configurations change, who’s changing them, what changed, and performance impact—helping you have the necessary visibility to troubleshoot faster, improve security, and demonstrate compliance.
Storage Resource Monitor
Get a comprehensive view into the performance and capacity of your heterogeneous storage environment with agentless NAS and SAN attached storage monitoring and reporting using SolarWinds Storage Resource Monitor (SRM). Visualize your storage environment including volumes, RAID groups, storage pools, disks, and more. Extend your SolarWinds Server & Application Monitor (SAM) and Virtualization Manager monitoring and reporting down to the device level with Storage Resource Manager Orion Platform integration.
Virtualization Manager
SolarWinds Virtualization Manager (VMAN) is designed to be an intuitive tool for virtualization monitoring, performance management, capacity planning, and optimization across VMware vSphere, Microsoft Hyper-V, and Nutanix AHV environments. Virtualization Manager is affordable and easy to download, deploy, and use.
Web Performance Monitor
SolarWinds Web Performance Monitor (WPM) tracks user experience and tests transactions for internal and external web sites and web-based applications—from any location. Quickly identify slow or failing elements, then troubleshoot down to the supporting infrastructure, from web server and database to storage hardware.
Log Analyzer
SolarWinds Log Analyzer is a powerful log management and analysis tool designed to fully integrate with the Orion Platform and provide users with a mechanism to realize the potential of their log data. With real-time log collection, analysis, and visualization, you can gain out-of-the-box visibility into the performance and availability of your IT infrastructure and applications.
Orion Platform Products
NETWORK PERFORMANCE MONITOR
Network Performance Monitor
SolarWinds Network Performance Monitor (NPM) is a powerful and affordable network monitoring software enabling you to quickly detect, diagnose, and resolve network performance problems and outages.
NETFLOW TRAFFIC ANALYZER
NetFlow Traffic Analyzer
An add-on to Network Performance Monitor, SolarWinds NetFlow Traffic Analyzer (NTA) is a multi-vendor flow analysis tool designed to proactively reduce network downtime. NTA delivers actionable insights to help IT pros troubleshoot and optimize spend on bandwidth by better understanding the who, what, and where of traffic consumption.
NETWORK CONFIGURATION MANAGER
Network Configuration Manager
SolarWinds Network Configuration Manager (NCM) can help save time and improve network reliability and security by managing configurations, changes, and compliance for routers, switches, and other network devices.
Accelerate troubleshooting of performance issues following configuration changes through integration with the Orion Platform’s PerfStack feature.
IP ADDRESS MANAGER
IP Address Manager
A big part of dealing with today’s complex networks and the challenges they present begins with managing your inventory of IP addresses and vital DHCP and DNS resources. SolarWinds IP Address Manager (IPAM) can provide you with centralized IP address management working hand-in-hand with unified DHCP and DNS administration and helping teams find and configure available addresses on DHCP and DNS systems.
VOIP & NETWORK QUALITY MANAGER
VoIP & Network Quality Manager
SolarWinds VoIP & Network Quality Manager (VNQM) is designed to monitor VoIP performance by analyzing call detail records generated by Cisco Unified Communications Manager and Avaya Aura Communication Manager, and can help you proactively identify and eliminate distortion, latency, and noise. It can also generate synthetic VoIP traffic using Cisco IP SLA technology and facilitate capacity planning and measurement of voice quality in advance of new VoIP deployments. VNQM is also built to track key edge router and switch statistics and can help you keep a close eye on site-to-site WAN performance.
USER DEVICE TRACKER
User Device Tracker
SolarWinds User Device Tracker (UDT) delivers automated user and device tracking along with powerful switch port management capabilities, so you can stay in control of who and what connects to your network. Quickly find a computer or user and track down lost or rogue devices with a simple search on a username, IP address, hostname, or MAC address.
SERVER & APPLICATION MONITOR
Server & Application Monitor
SolarWinds Server & Application Monitor (SAM) is designed to monitor your applications and their supporting infrastructure, whether running on-premises, in the cloud, or in a hybrid environment. Don’t let slow applications and downtime impact your end users and business services. Pinpoint the root cause of application issues across various layers of the IT stack. Automatically discover your application’s environment and start monitoring typically in about an hour. No professional services or consultation needed.
SERVER CONFIGURATION MONITOR
Server Configuration Monitor
When configurations start to drift, the impact can be very serious: Outages, slowdowns, security breaches, and compliance violations. SolarWinds Server Configuration Monitor (SCM) is designed to quickly reveal when server, application, or database configurations change, who’s changing them, what changed, and performance impact—helping you have the necessary visibility to troubleshoot faster, improve security, and demonstrate compliance.
STORAGE RESOURCE MONITOR
Storage Resource Monitor
Get a comprehensive view into the performance and capacity of your heterogeneous storage environment with agentless NAS and SAN attached storage monitoring and reporting using SolarWinds Storage Resource Monitor (SRM). Visualize your storage environment including volumes, RAID groups, storage pools, disks, and more. Extend your SolarWinds Server & Application Monitor (SAM) and Virtualization Manager monitoring and reporting down to the device level with Storage Resource Manager Orion Platform integration.
VIRTUALIZATION MANAGER
Virtualization Manager
SolarWinds Virtualization Manager (VMAN) is designed to be an intuitive tool for virtualization monitoring, performance management, capacity planning, and optimization across VMware vSphere, Microsoft Hyper-V, and Nutanix AHV environments. Virtualization Manager is affordable and easy to download, deploy, and use.
WEB PERFORMANCE MONITOR
Web Performance Monitor
SolarWinds Web Performance Monitor (WPM) tracks user experience and tests transactions for internal and external web sites and web-based applications—from any location. Quickly identify slow or failing elements, then troubleshoot down to the supporting infrastructure, from web server and database to storage hardware.
LOG ANALYZER
Log Analyzer
SolarWinds Log Analyzer is a powerful log management and analysis tool designed to fully integrate with the Orion Platform and provide users with a mechanism to realize the potential of their log data. With real-time log collection, analysis, and visualization, you can gain out-of-the-box visibility into the performance and availability of your IT infrastructure and applications.